Science Fair aims to share projects, ideas and prototypes in which the Influence Mapping community is working. It addresses the challenges they are facing in their development and also in reaching their users. Our last session focused on two Latin American mapping projects: Nodemapper and Cargografías.
NodeMapper NodeMapper is a Chilean initiative led by Miguel Paz (@miguelpaz), CEO of Poderopedia. NodeMapper seeks to build simple visualizations of networks from a Google Spreadsheet to publish or embed them in websites, without coding, in just a few minutes. NodeMapper is currently an early trial of the concept version.
The goal of developing the tool is to expand and democratize the use of data to do visual storytelling for people and organizations that don’t have access to programmers. This opens new possibilities for anyone interested in creating and publishing visualizations of connections, in a fast and simple way.
Its main final users are journalists without coding skills or access to programers, that work on written pieces that have to do with connections, as well as citizens who are active in civic media that would like to report on the issues that affect them. The users will be able to visualize networks with less than 100 nodes, being 20 to 30 nodes average.
According to Paz, they haven’t thought of using Popolo or other standards. For now, they are not thinking of building a tool for connecting standards either. Their approach is first of all to get people to use the tool and then to add other features, according to their needs. That’s why they are looking for journalists, designers, developers, academics, civic advocates and organizations interested in testing NodeMapper with real data, to join the alpha tester group.
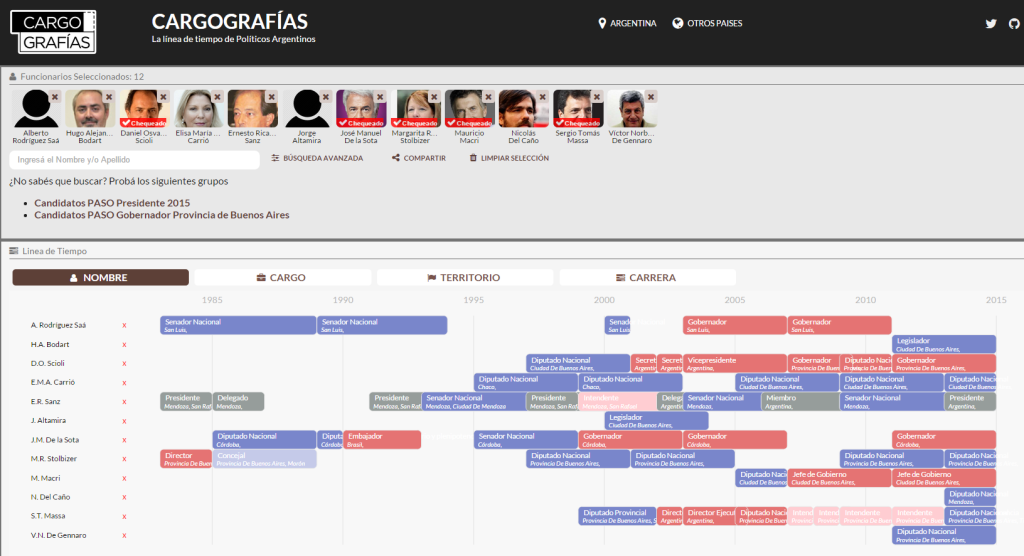
Cargografías Cargografías is a visualization tool that allows users to visualize in a timeline the careers of politicians over time. The tool was developed by Andrés Snitcofsky (@rusosnith) for journalists who need to add visualization to their writings, investigators getting clues out of tons of data and civic society and NGOs trying to uncover lost trails. Nowadays, Cargografías has teamed up with Chequeado, another Argentine project, and has worked with Animal Político (Mexico), to check data and publish timelines.

Last May, Cargografías was awarded with a $10,000 grant in the recent HacksLabs Challenge 2015, the first data journalism accelerator fund for Latin America. Because of the grant, Cargografías was able to launch its 5.0 version. This version, according to Snitcofsky, has a lot of improvements, mostly focused on sharing the timeline, embedding in another websites and finally, better usability.
The tool, whose code and data is open and uses Popolo standard, was born in Argentina and currently is looking to replicate it in other countries, mostly in Latin America. They already have “ambassadors” in Mexico (SocialTIC, Animal Político), Perú (Ojo Público, Open Data Perú) and Uruguay (DATA.uy), between others.
Also, the Cargografías team is willing to build a replacement for Popit Poplus complement and further in time adding other visualizations and capabilities to personalize visualizations, so users can use Cargografías not only as a source, but also as a tool. This goal is being approached on the next release of Cargografías Javascript plugin, which will allow anyone who needs to visualize their own timeline to use it as an independent module.
See: Code repo // Web // @cargografias
Other notes from the Science Fair:
ResourceContracts.org was recently updated. See Alpha API and schema for metadata and Workflow.
Announcements:
Mapa de Medios launch, Poderomedia Foundation (Santiago, Chile / Bogotá, Colombia) - August 20th, 2015 (TBD).
Mediaparty (Buenos Aires, Argentina) - August 27th-29th 2015. For the fourth consecutive year, the three-day event Hacks/Hackers Buenos Aires Media Party will bring together journalists, software programmers and designers from four continents to work together for the future of the media.
Abre Latam, Open Data Unconference (Santiago, Chile) - September 7th-8th 2015.
ConDatos, Third Regional Open Data Conference in Latin America and the Caribbean (Santiago, Chile) - September 9th-10th 2015.
The next meeting will take place in August 18th, at 4 PM UTC. If you’d like to present an idea or demo of influence mapping related projects, please sign in this Etherpad.