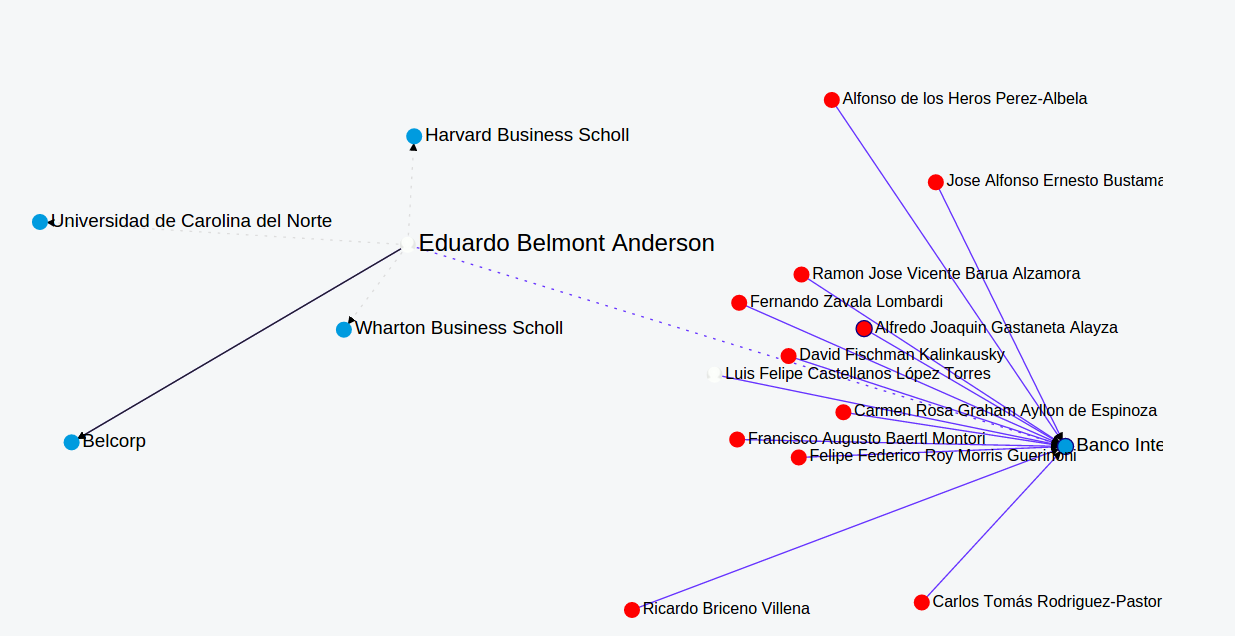
[caption id=”attachment_486” align=”aligncenter” width=”1090”] “Negocios en el Caribe: las ‘offshore’ de los grupos de poder del Perú” (Ojo Publico, Who is Who Wiki Collaboration)[/caption]
Science Fair aims to share projects, ideas and prototypes in which the Influence Mapping community is working. It addresses the challenges they are facing in their development and also in reaching their users. Our November session demonstrated that public spending investigation is fun and that there’s a way to Wiki the power in Mexico.
Who is Who Wiki, presented by its project Coordinator Eduard Martín-Borregón (@emartinborregon)
Who’s Who Wiki, is a tool for corporate transparency in Latin America. It was developed by the Project on Organizing, Development, Education, and Research (PODER).
“Who’s Who Wiki” (WWW), or Quién es Quién Wiki in Spanish, is an open data, open software platform that addresses the lack of transparency in the Latin American private sector through monitoring companies, corporate elites, and their government counterparts.
The tool is allows users to access corporate data that otherwise is often inaccessible, from diverse sources, countries, and languages, all concentrated in one place, in Spanish, with a rigorous research and verification methodology. An important component of this platform is that it uses wiki technology, which enables user participation to collaboratively populate the database. Poder's editorial team can monitor those changes, check the public source and verify the information.
See: Web // @QuienesQuien
Public Spending in EU, presented by Adriana Homolova (@naberacka)
Adriana is looking to address public spending investigation, which she believes is under reported mainly because the “vast amount of unstandardized information makes it time consuming and complicated to investigate”.
“And while (investigative) journalists can excel in applying qualitative methods, they are often far from excelling even in Excel". That’s why she’s working on a tool that enables journalists to analyze and visualize tendering data and look for patterns that suggest corrupt behavior in public spending. “Our tool aims to make quantitative research easy for even the least technical person”, says Adriana.
At this moment, Adriana and her team are working on prototype which will be able to filter and visualize TED tendering data from as early as 1993 up until 2015. The prototype will be finished at the beginning of 2016. The user will be able to choose a market, country and a year and explore the network visualization, as well as a list of tenders. User can also choose to explore only tenders acquired by a particular company or given by a particular public body. Network visualization will provide a market overview as well as hint at suspicious patterns, such as market domination or lack of competitiveness.
In the extended version, journalists will be also able to map data collected by themselves.
Join the discussion on tenders and stay tuned for a new tool to investigate networks of public spending!
Also, read the full Knight’s Challenge proposal for more info on the project.
***
Later this month Adriana invited the Influence Mapping community to participate in the game “Who wants to be a supplier?”, another initiative of tenders.exposed, the team that aims to make investigation into public spending sexy.
To play the game, go to the website, use the lottery machine and let it chose a market, country and the year for you. Or just go to the tool, browse through CPV codes and have a look at tenders in your country.
Did you enjoy the game? Send some feedback and share it in social media!
***
Interesting links shared at the Science Fair:
- "Map the Terrain" Tool: Tool to map out the terrain of human relationships, including identifying the people, groups and institutions working both for and against change.
- LittleSis team is working on making this a re-usable graph visual that's really neat and organized: Oli2 + Github repo
- Corpnet, Research on Corporate Network Governance:
Ideas:
- Being able to mix CRM data with a power map would be super amazing!
The next meeting will take place in December 18th, at 10 AM NY. If you’d like to present an idea or demo of influence mapping related projects, please sign in!