In the last Science Fair, we were joined by NarcoData’s Yosune Chamizo and Miguel Paz. Chamizo led the design process of the nine data visualization projects that were born from the collaboration between the Mexican Media Animal Político and the Chilean Influence Mapping Media, Poderopedia.
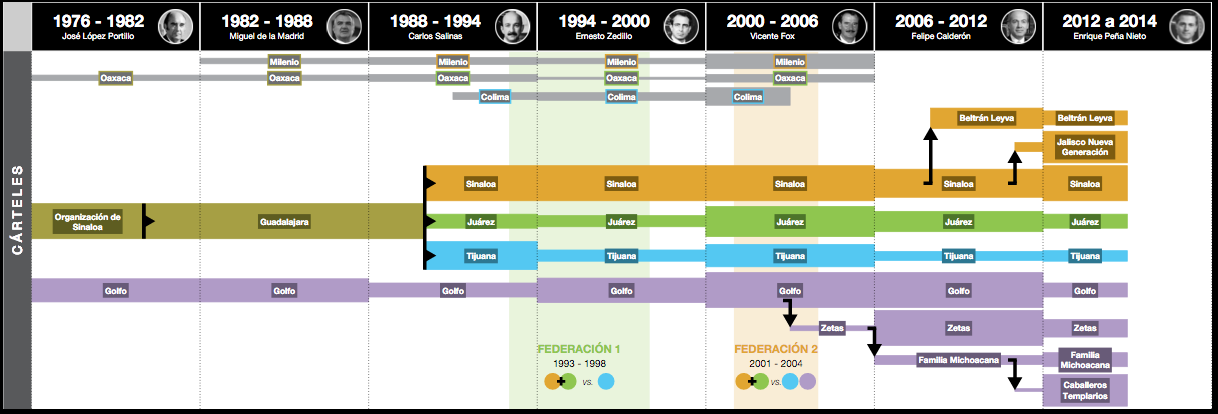
NarcoData shows the history of Narcos in the past decades, and how its geographic reach and power structures have changed during this time. It also connects this process with the political and Government process in Mexican society.
The overall project was born from a single, but powerful FOIA request, that gave Animal Politico’s team official information about the corruption cells that were operating in Mexico and to which cartel they belonged. This was the milestone of the project, that led to a harder process, with further FOIA requests, interviews with different authorities in the field and research in documentary sources. After this process, the team was ready to start designing how drug trafficking became as influential as it is today.
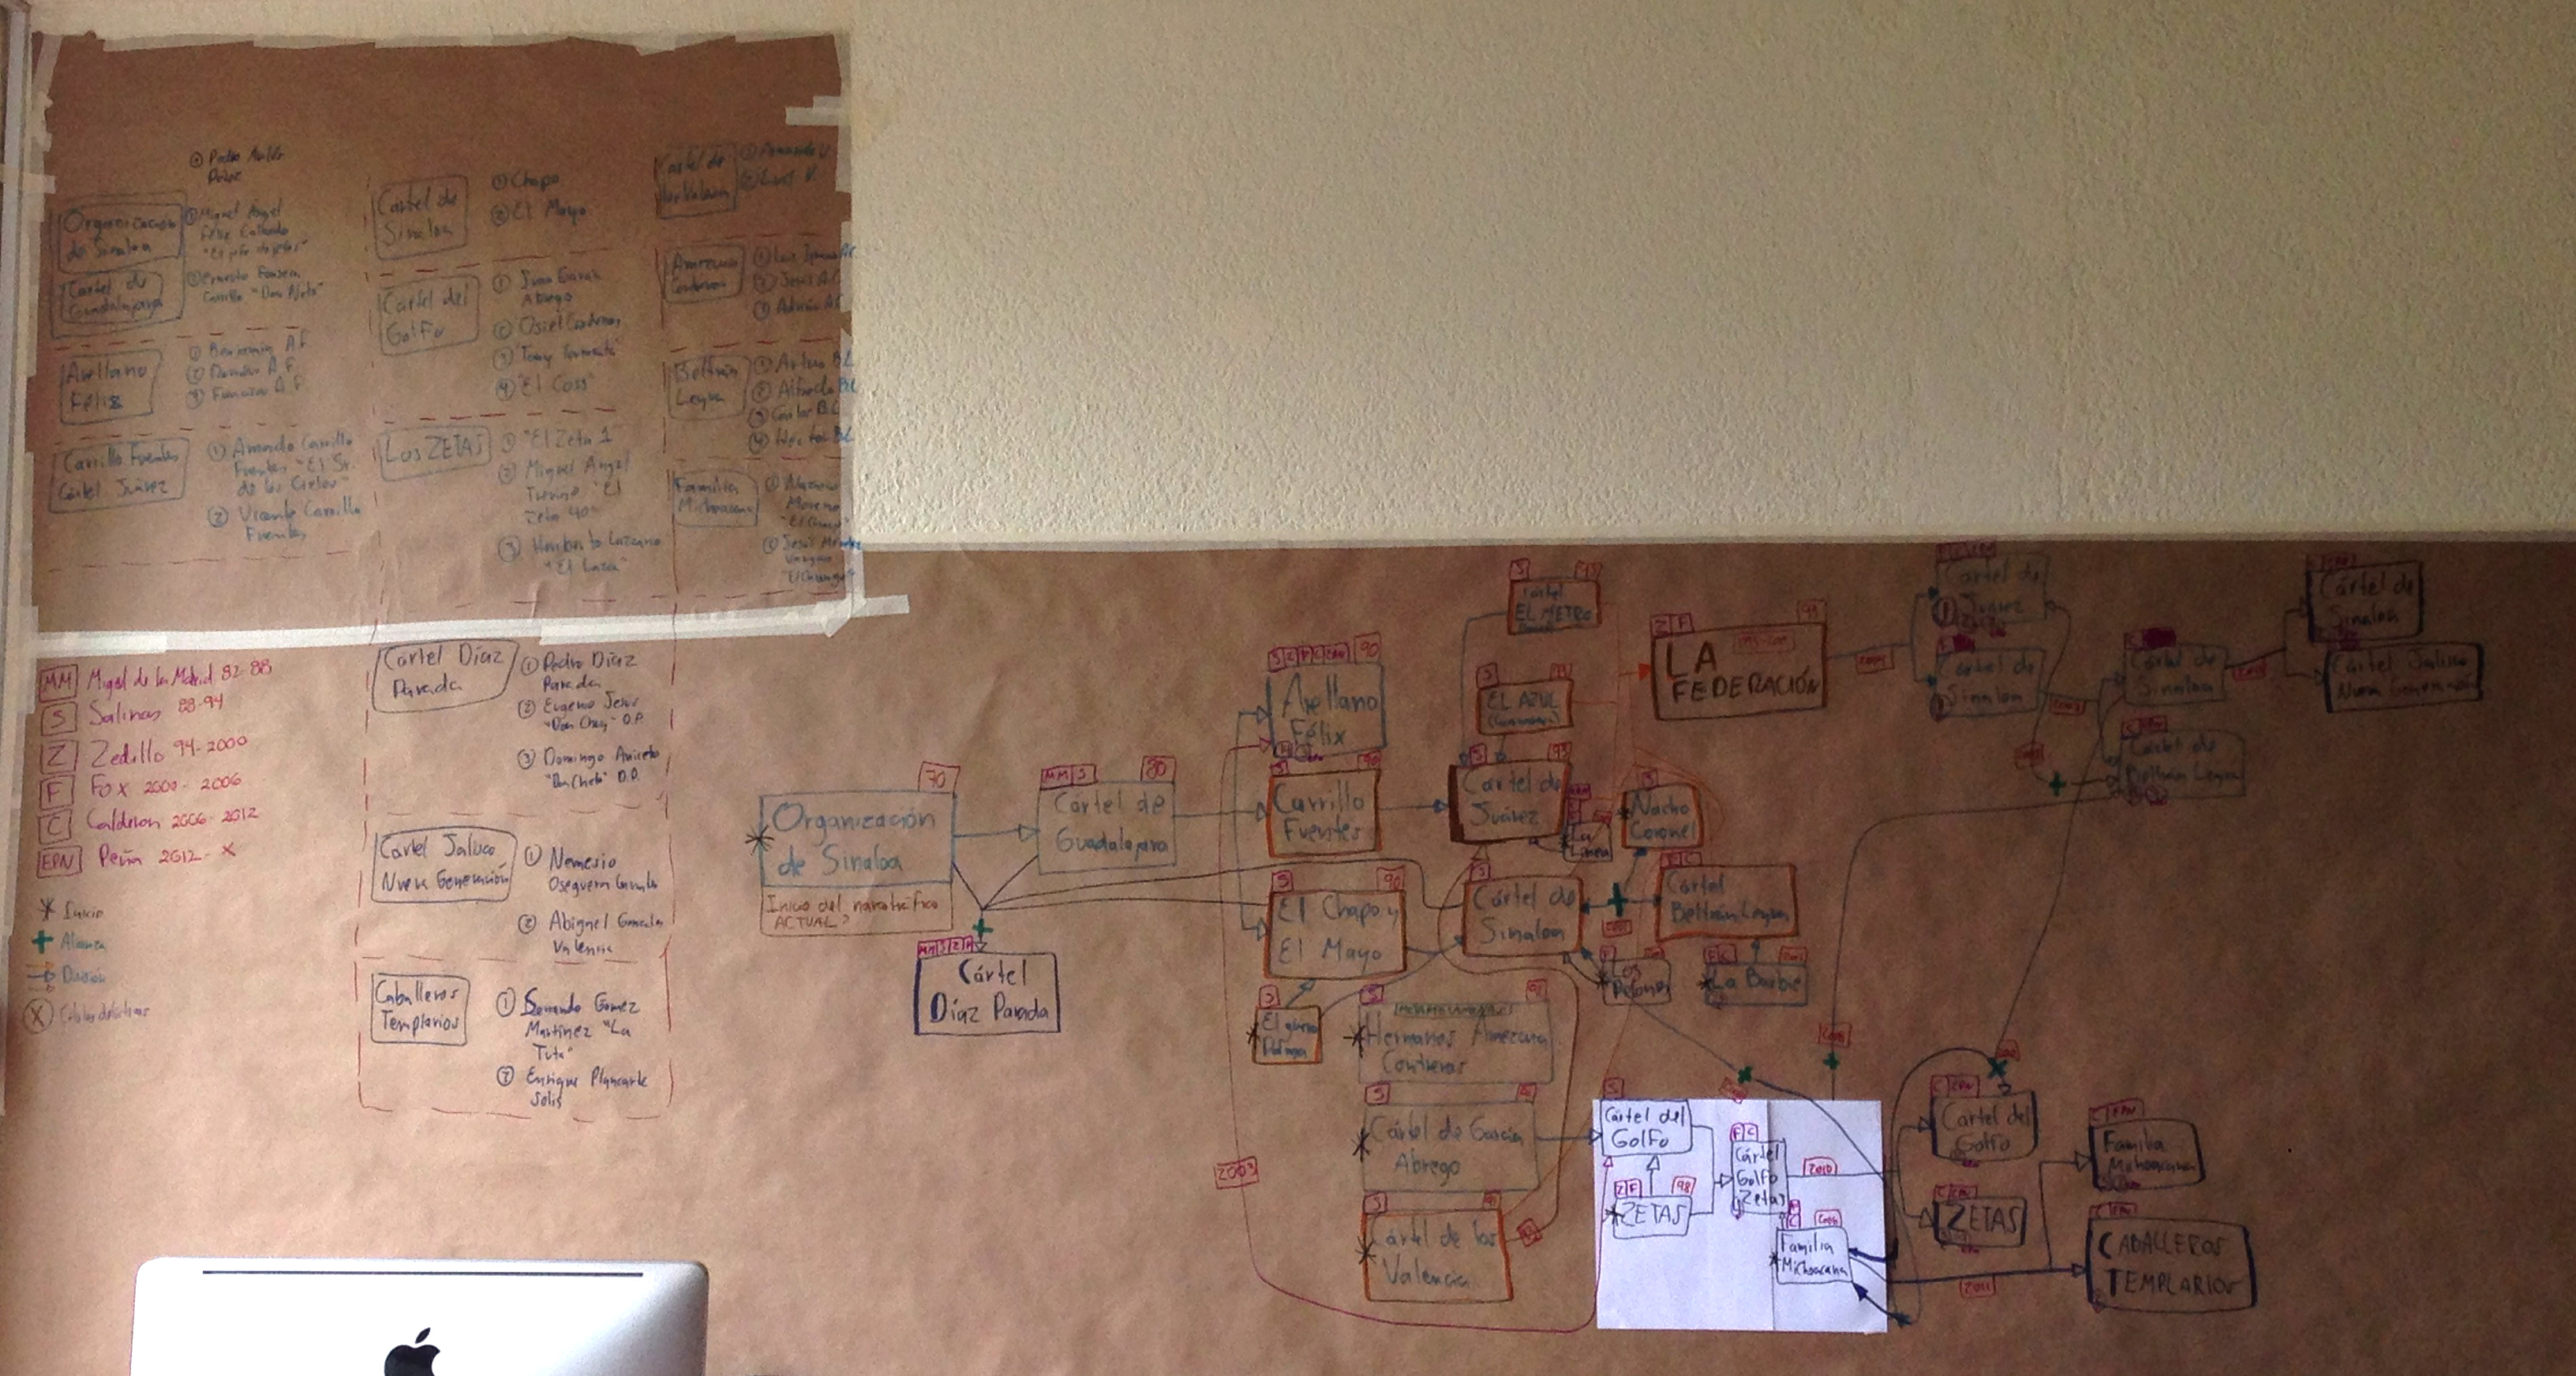
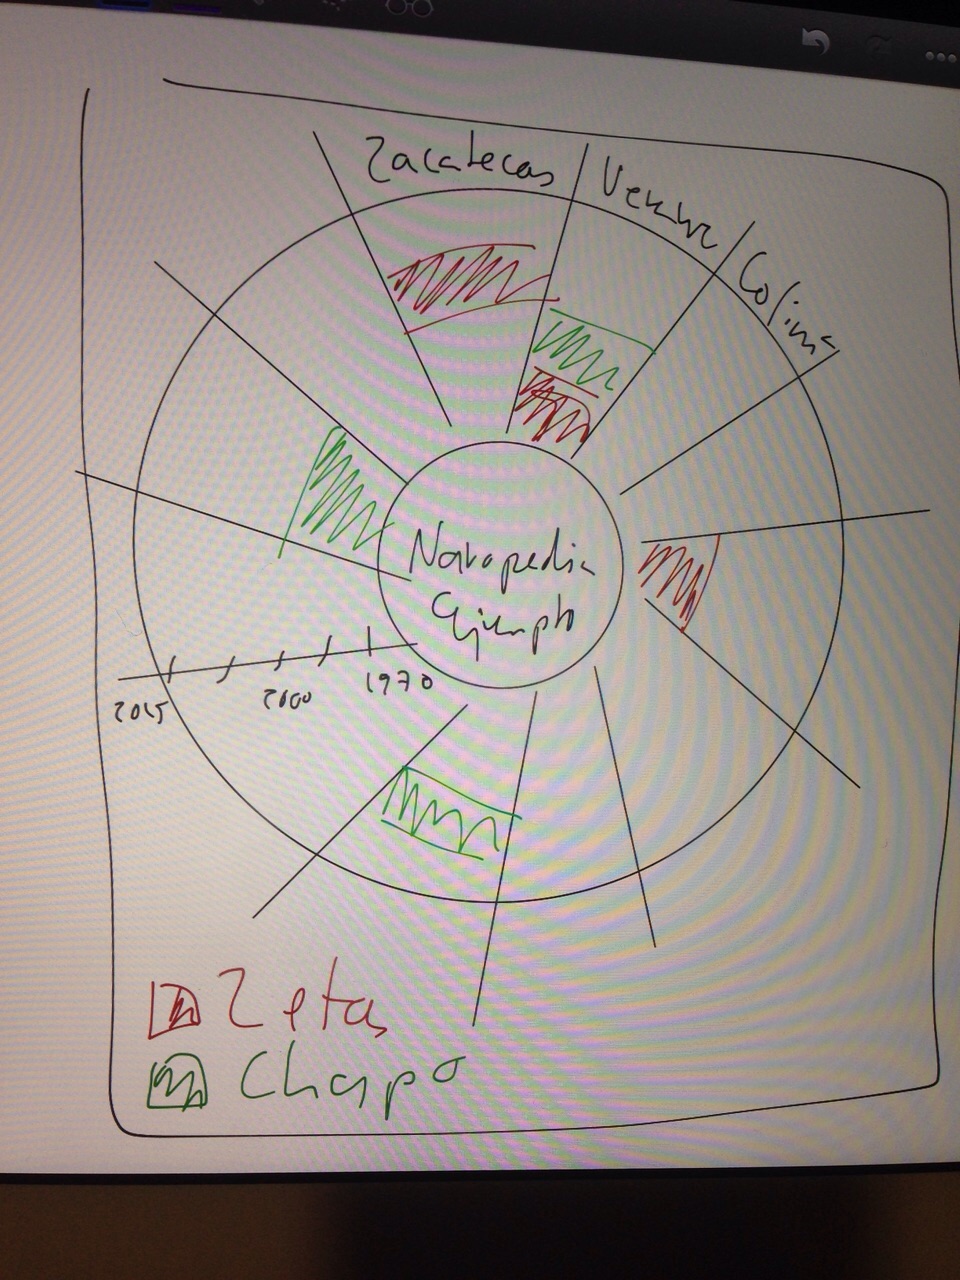
One of the most interesting parts, said Yosune in the Science Fair gathering, “was to think about the FOIA requests as stories”. Their first approach in visualizing the information was to create a big, complex visualization that would include most of the information. After drafting how this would turn out, they decided to create not one, but several visualizations, around more specific topics.
[caption id=”attachment_510” align=”alignnone” width=”3264”] NarcoData’s first draft (via NarcoData’s team)[/caption]
[caption id=”attachment_512” align=”alignnone” width=”960”] NarcoData’s first draft (via NarcoData’s team)[/caption]
[caption id=”attachment_513” align=”alignnone” width=”1218”] NarcoData, “Cuatro décadas de crimen organizado en México” visualization[/caption]
Some of the challenges the design team had to face were to represent the different “sizes” of the group, in terms of geographic reach, power and members. After a few iterations, they finally got to their first visualization, which worked as a foundation for the next eight designs.
The team received user feedback during the whole design process through user tests. Through it, they noted that their biggest problem was mobile visualization due to the amount of information they were including.
One of the main goals of the project was to make the process of understanding the “drug lords” impact through time as easy as possible. And apparently, they achieved it: “My mother called me in the morning and told me she finally understood drug trafficking in Mexico”, says Yosune, explaining how fulfilling this experience was.
Matching entities of interest
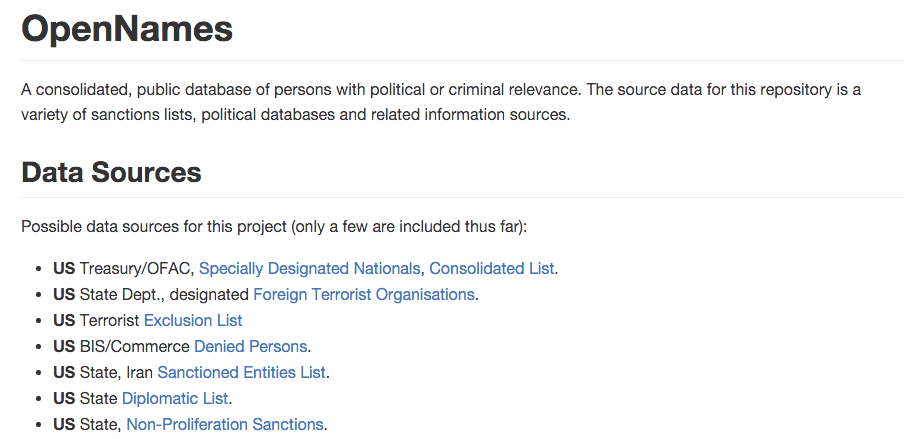
During the creation of PEP’s databases for OCCRP, Friedrich discovered that there’s a lot of information about PEP’s that’s open source. So after creating a series of scrapers for places like EveryPolitician, he created the project OpenNames:
[caption id=”attachment_514” align=”alignnone” width=”904”] OpenNames Github[/caption]
Right now he’s trying to find out how this can be useful. One interesting approach that came up in the Science Fair, was to go beyond the political, like state legislates and state parliaments families.
One of the challenges about the database regards the surnames and types of names: it’s hard to understand how names around the world work and how one can split them up.
If you have feedback on data sources, specially if it includes “non-politicians” related to politicians, or information sources around how people’s names are configured in different countries, please share with @pudo. Andrés Snitcofsky (@rusosnith) already committed himself for sharing Cargografías data and Guatemala info.
The final question that came up is probably one that comes up during every influence mapping meet up: Are we helping the good ones?
The next meeting will take place in January 19th, at 10 AM NY, and will host David Cabo form Civio, presenting their influence mapping project, Onodo.
If you’d like to present an idea or demo of influence mapping related projects, please sign in!