Stories and thoughts
Explore Panama Papers and its data model
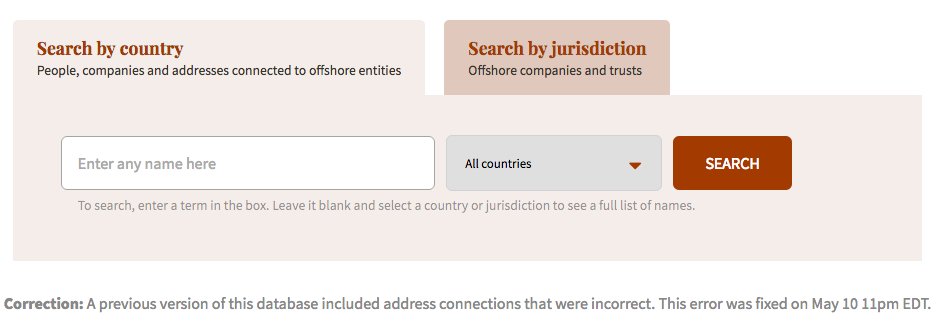
As you may know, you can now explore and find out who is behind almost 320,000 offshore companies and trusts from the Panama Papers investigation. The team also suggests how to use the database.
Check out the graph data model used by the ICIJ and explore how they constructed it using Cypher in Neo4j and watch Mar Cabra -lead editor of the #PanamaPapers investigation- in the last GraphConnect Europe conference in London explaining “how they use tech to tell great stories”.
See also:
-
The biggest hope for ending corruption is open public contracting (Huffington Post)
-
How the Nonprofit Newsroom Behind the “Panama Papers” Investigation Measures Impact (Mediashift)
-
Public Beneficial Ownership: We need open, not just public data(OpenCorporates response on public beneficial ownership registers commitments due to Anti-Corruption London)
Learning from Lombardi
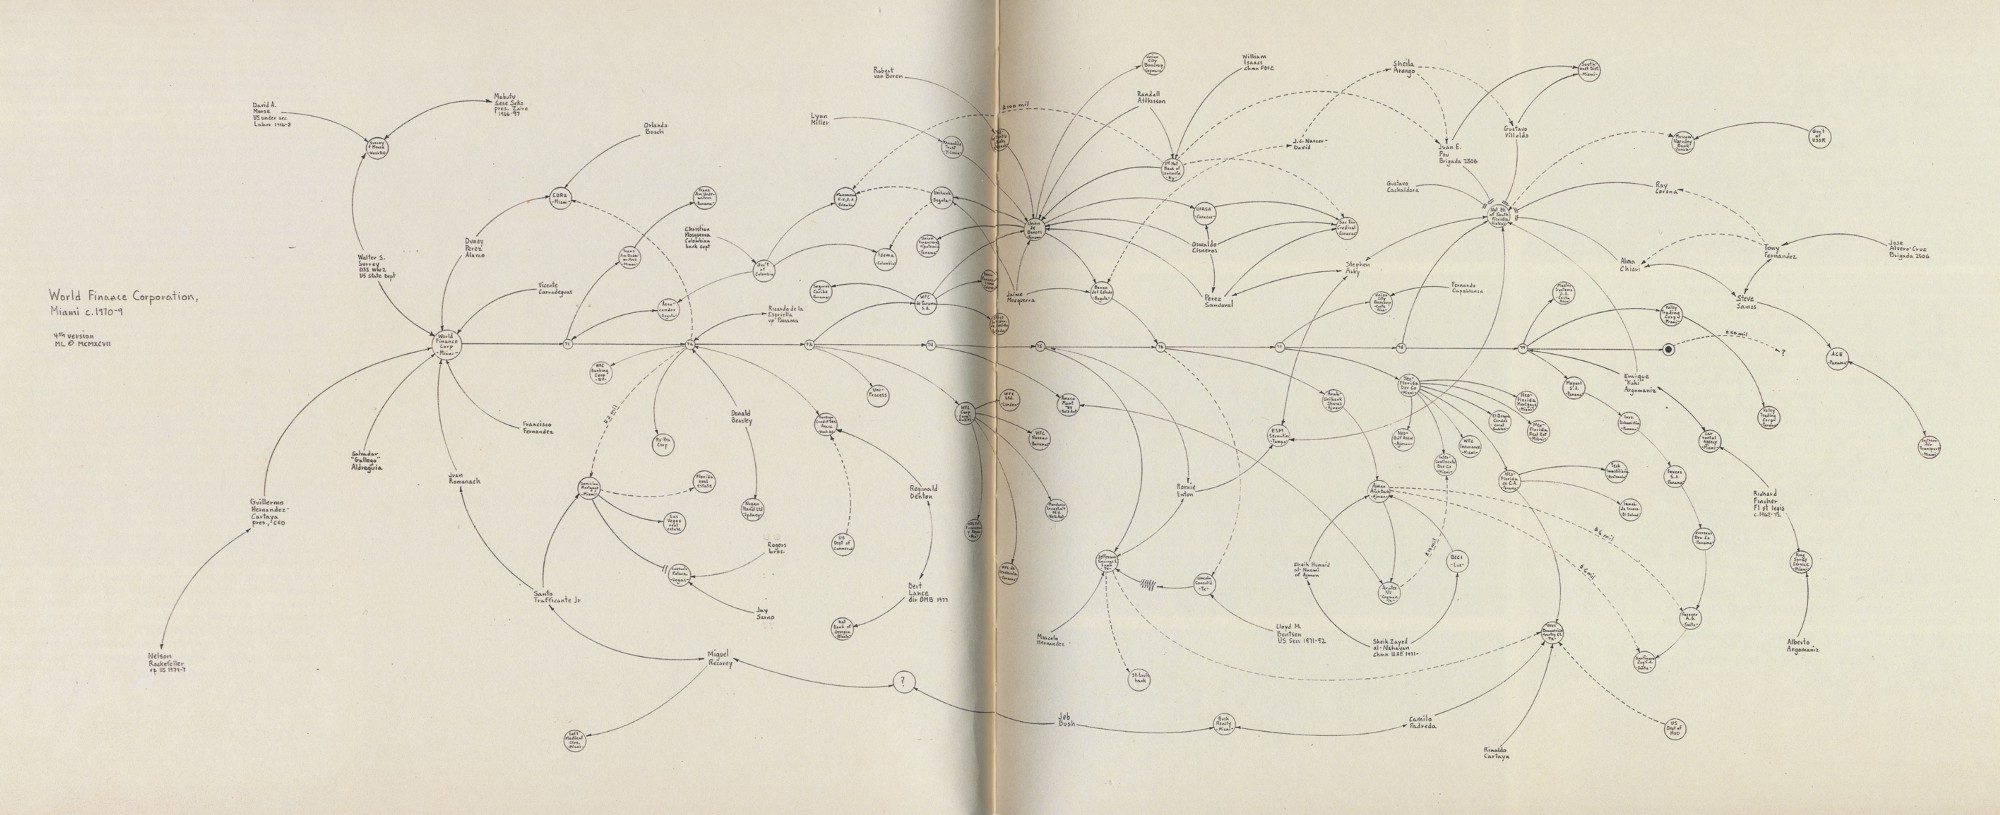
“In Lombardi’s case, even his early scribbles on a project are more informative, because they show a fundamentally human thought process, of trying to draw the story out of the mass of data he had collected. This is the opposite of many computational approaches that begin with a mass of data, followed by an often failed attempt to simplify it”.
This article was originally prepared in 2009 by Ben Fry, founder @FathomInfo, and it goes through his experience getting to know Lombardi’s creative process.
Thoughts on open data

What's wrong with open-data sites, and how we can fix them By Cesar Hidalgo, MIT Associate Professor whose team recently created Data USA
‘Free your data’ is over. Now, we need data to be free: Co-founder of Journalism++, Nicolas Kayser-Bril on why it’s important for data journalists to be more careful with government data and should collect more data independently.
Over-politeness is the fatal flaw in the open data movement: According to Tom Steinberg, “overly-friendly collaboration between governments and transparency advocates sucks the oxygen out of the room”. Check out also John Wonderlich (Sunlight Foundation) response to the article.
Tools
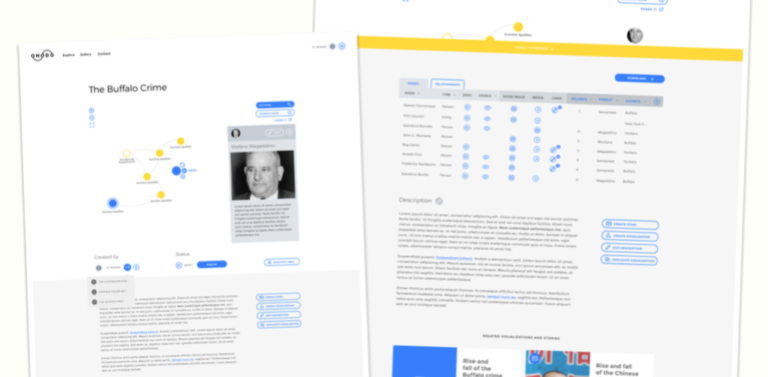
Onodo, an open source network analysis tool for non-tech users (Influence Mapping)
The tool will feature a replicable and collaborative platform which will facilitate integration with other tools and will allow to import and integrate bulk data from multiple sources. The beta version will be launched by the end of May and presented at Democracy Lab.
April's Toolkit
Polyglot // A natural language pipeline that supports massive multilingual applications for language analysis.
ParseKit // Enigma’s new infrastructure for building and managing data pipelines
Dataproofer // This tool is built to automate the process of checking a dataset for errors or potential mistakes.
Municipal Money API // It publishes the financial information of South African municipalities in a machine-friendly format.
Represent // Browse the latest votes and bills, see how often lawmakers vote against their parties and compare voting records (API here)
Aleph // Tool for indexing large amounts of both unstructured (PDF, Word, HTML) and structured (CSV, XLS, SQL) data for easy browsing and search. It is built with investigative reporting as a primary use case. aleph allows cross-referencing mentions of well-known entities.
See also:
-
Investigative Dashboard Search: Lets you search across 2.4 million data and documents from previous investigations, official sources, and scraped databases (OCCRP)
-
Kumu just released the beta version of custom controls to customize the interface with a timeline for seeing how a network changes over time, dropdowns to filter by fields, and more.
-
OpenCorporates just reached 100 million companies.
-
Lessons learned from building Tax Clock and Vote for the Budget (Code for South Africa)
Reports and Resources
Your friendly guide to colors in data visualisation
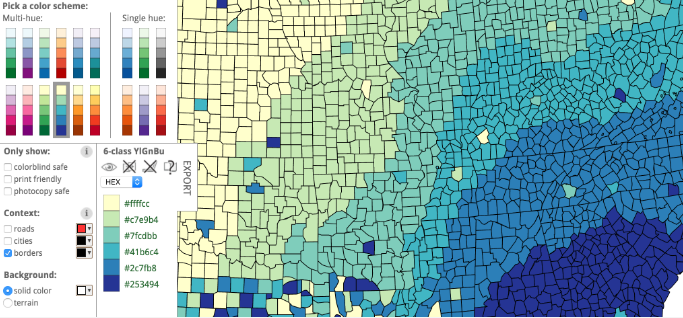
Lisa Charlotte Rost asked her Twitter followers: “Can somebody tell me how to get better with color? My color decisions are awful”. These are the websites and tools that her followers recommended, with her thoughts around them.
-
It's none of your business! – Report on Europe’s Closed Company Registers (Access Info + OCCRP)
-
2016 World Press Freedom Index (Reporters Without Borders)
-
Fourth round of Africa Integrity Indicators data now available! (Global Integrity)
- Third Open Data Barometer (World Wide Web Foundation)
Map
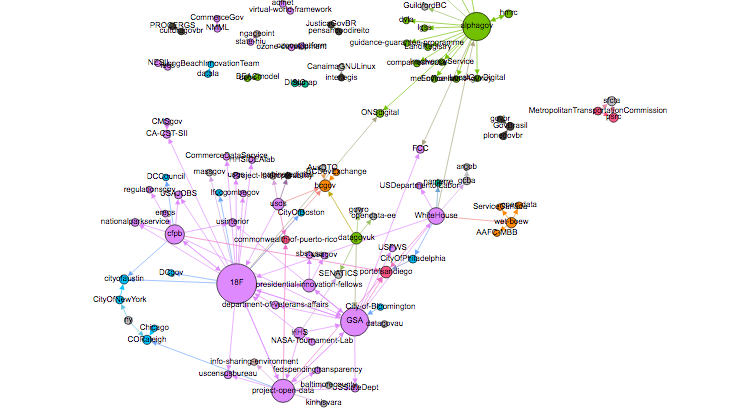
The government GitHub ecosystem: Using GitHub’s API, Emmanuel Feld compiled a database of government GitHub organizations, their repositories, members, and contributors and dove in.
Next Events
- May 13-14: Hacks/Hackers Connect: Miami (Miami, FL)
-
May 13-15: DemFest: A new festival of democracy (North Wales, UK)
-
May 21: ONA Brasil: Encontro de Jornalismo e Empreendedorismo (Sao Paolo, Brazil)
-
May 15: Last day to apply for a scholarship to JAWS CAMP 2016
-
May 16: Webinar “How to increase transparency and efficiency at local government level through on-line services”, hosted by The Institute for Democracy and Mediation (IDM) in Tirana, Albania.
-
June 4: National Day of Civic Hacking 2016, Code for America (USA)
-
June 5-6: Personal Democracy Forum (NY, USA)
-
June 10: Apply: Personal Democracy France
-
July 14-16: #CIJ Summer Conference 2016 - Be up to Data (London, UK)
