Stories and thoughts
Tools & Projects
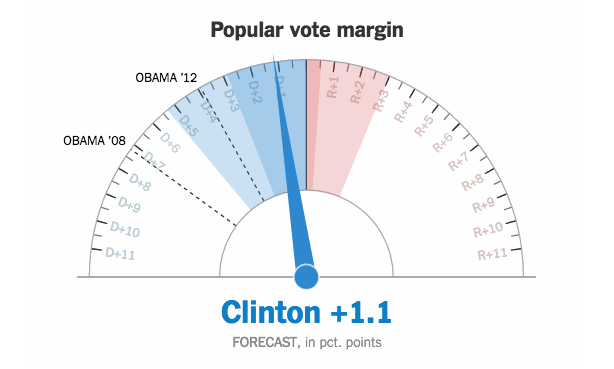
HU.S. Election: The NY Times showed a live gauge to show the current forecast for Clinton and Trump
During the election, The New York Times showed a live gauge to show the current forecast for Clinton and Trump. It moved to show a 25th to 75th percentile band of uncertainty. How do you get the general public to understand more concretely?
U.S. Elections
This month the US Elections led to great number of stories with data, investigative journalism and visualizations:
- A guide to Public Records and the Trump Presidential Transition (MuckRock)
- A new era: our elections now will be decided by hackers and leaked data (The Guardian)
- After Trump’s win, news organizations see a bump in subscriptions and donations (NiemanLab)
- Journalists fear for their profession under Trump – and some, for their safety (Politico)
- Why botched election predictions don't herald the end of data journalism (Digiday)
- Trump’s Win Isn’t the Death of Data—It Was Flawed All Along (Wired)
Other stories & thoughts from this month
- Bubbles, Bars and Pictographs: Understanding data and visual literacy in Kenya (Callie Long, Internews)
- Clan Obiang: The Eastern European Network of an African Dictator (OCCRP)
- Responsible Data Leaks and Whistleblowing (The Engine Room)
-
What would the open data utopia actually look like? (ODI)
-
From Tech-Driven to Human-Centred: Opengov has a Bright Future Ahead (Martin Tisné, Medium)
-
What do investigators, government, procurement & tax officers want from a global beneficial ownership register? (Global Beneficial Ownership Register)
This month’s learnings on…
- Improving the UK digital statute book through collaborative maintenance (ODI)
-
Getting your open data project started (Open Data Delaware)
-
How to win international reporting grants (Ijnet)
-
What is “Open Washing”? (Web Foundation)
-
The basics of phishing attacks: What journalists need to know to stay safe (Ijnet)
Month's Toolkit
- JavaScript InfoVis Toolkit // This library has a number of unique styles and several animation effects.
- Data Journalism with R // A great curated set of resources for learning.
- JavaScript API, d3.jslibrary and lodash // A well-written guide for manipulating data with JS.
- NetworkX // Python language software package for the creation, manipulation, and study of the structure, dynamics, and functions of complex networks.
- Mozaïk // Tool based on Node.js, React, D3 stylus to easily craft beautiful dashboards.
- InvestigateIX // Open source search engine on an encrypted external device.
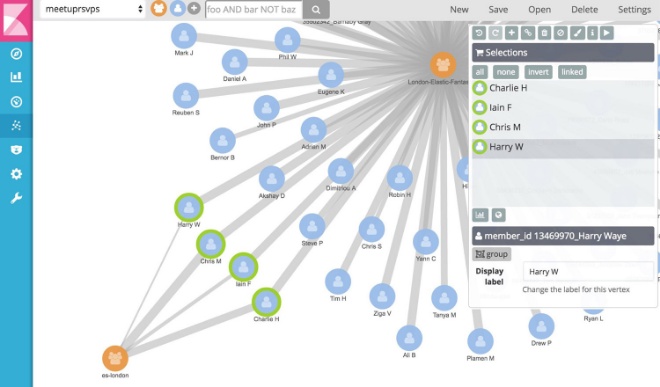
- Kibana for Elastic Search // User interface for search, interactve filtering and data visualization
Resources on...
- Investigative journalism // UNESCO and IPYS launched an Investigative journalism guide
- Political Information // Mapping and quantifying political information warfare
- Data Strategy // It’s not the size of data, it’s what you do with it that counts
- Quality of open data // Four things you should know about open data quality
- Coding for journalists // How journalists can get started with coding
- FOIA // Connecting freedom of information to open data: How to build a better FOIA.gov
Reports
“Data has the potential to help communities understand their biggest challenges – why people become sick or well, why development initiatives succeed or fail, how government actions align with citizens’ priorities.
This report explains the role of data journalists and open data, and lays out the key considerations that can help predict the success or failure of new data journalism initiatives” (Internews).
- Witness Interference in Cases before the International Criminal Court (Open Society Foundations)
- People and corruption: Europe and Central Asia 2016 (Transparency International)
-
Analyzing the state of open data in 2016 (Data Foundation and Grant Thornton)
- Global taxation – Financing the Sustainable Development Goals (Tax Justice Network)
Dataviz
CONVOCA launches the new map of power in Perú #ExpedienteDelPoder. Presented as a game “Juegos del Poder” is a great visualization about how are political parties financed.
Next events
- November 23: Hacks/Hackers London: November meetup (London, UK)
- November 24: #17: NZZ Storytelling (Zurich, Switzerland)
- November 25-26: Dublin Editors Lab (Dublin, Ireland)
- Dec 6-9: Internet Governance Forum (Guadalajara, Mexico)
- Dec 7-9: Open Government Partnership Global Summit 2016. Registration now open here.
- Dec 13: News Impact Summit (Amsterdam, Netherland)
- Jan 26-27: Researching Journalism and Media in a Digital Age (Sheffield, UK)
- Jan 27-28: 2017 Nordic Data Journalism Conference (Odense, Denmark)
Apply!
- Nieman Foundation Fellowships: International Fellowships (Deadline Dec. 1) + Martin Wise Goodman Canadian Fellowship (Jan. 6) + U.S. Fellowships (Jan. 31). More info on each here.
- MediaLab A+E Networks Digital Media Storytelling Fellowship. Apply here (Deadline Dec. 1, 2016)
- John S. Knight Journalism Fellowships at Stanford. Apply here (Deadline Dec. 1, 2016)
- Proposals: Internet Freedom Festival (Deadline Nov. 28)
- Grants: Grants fund investigative journalism from Ukraine, Belarus, Moldova (Deadline Dec. 31)
- Scholars: Medill graduate scholarship and internship program (Deadline Jan. 2)
- Scholarship: Northwestern and The Washington Post Scholarship program for software developers interested in journalism (Deadline Jan. 2)
- Proposals: Africa Open Data Network Research Coordination
- Job: Center for American Progress is hiring a D3js dataviz developer


